Services Penetrator
Dynamo Python script for managing services penetrations

Greenbox Architecture is a medium sized architecture practice specialised in data centres. It was a great place to learn Revit documentation, and I am greatful for the training in an aspect of architecture that had not been part of my education or previous roles.
At the time I worked there, while some people had basic Dynamo skills, nobody had the Python skills to solve these kind of challenges. The practice was highly Autodesk centric, so there was no other Rhino users or vision for what the architecture profession could be beyond drafting and coordination. At the time I put this down to Computational Design being a relatively new field, but I have come to understand that developing a computational culture takes time to win the buy in of management, and some companies are too small to make the economics work for the R&D effort vs the reward. Unfortunately this project was defunded at about 90% completion, so the benefits were never recieved for the effort. But it remains a lesson both technically, but also in choosing less ambitious targets that have lower effort low returns to demonstrate capability and implement before moving on to high effort high reward initiatives.
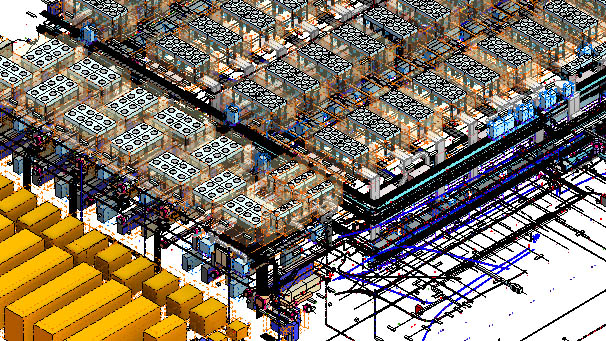
In 2017, they commissioned me to make a Dynamo Python script for finding, placing and tracking services penetrations between linked BIM models. Penetrations for services are one of the most critical things to get right in BIM models. Failure to correctly place them can cost a job millions! However, the reality of BIM coordination is that the architect, the hydraulic engineer, the electrical engineer, the mechanical engineer and just about every consultant and his dog are chasing each others tails trying to keep up with changes to these models. This is even worse on large complex buildings with far more services per square meter than other types of buildings, such as data centres and hospitals. Thousands of lines of python in one main node, with several others feeding into and out of it. On a full Data centre model, it could take 6 hours to run, computing thousands of intersections! That sounds like a lot, but imagine if the architect had to place them all manually?
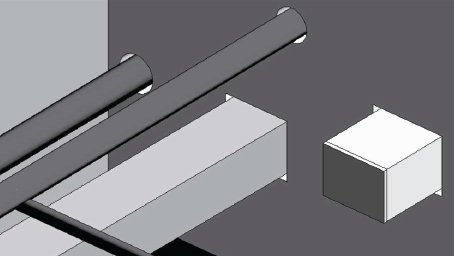
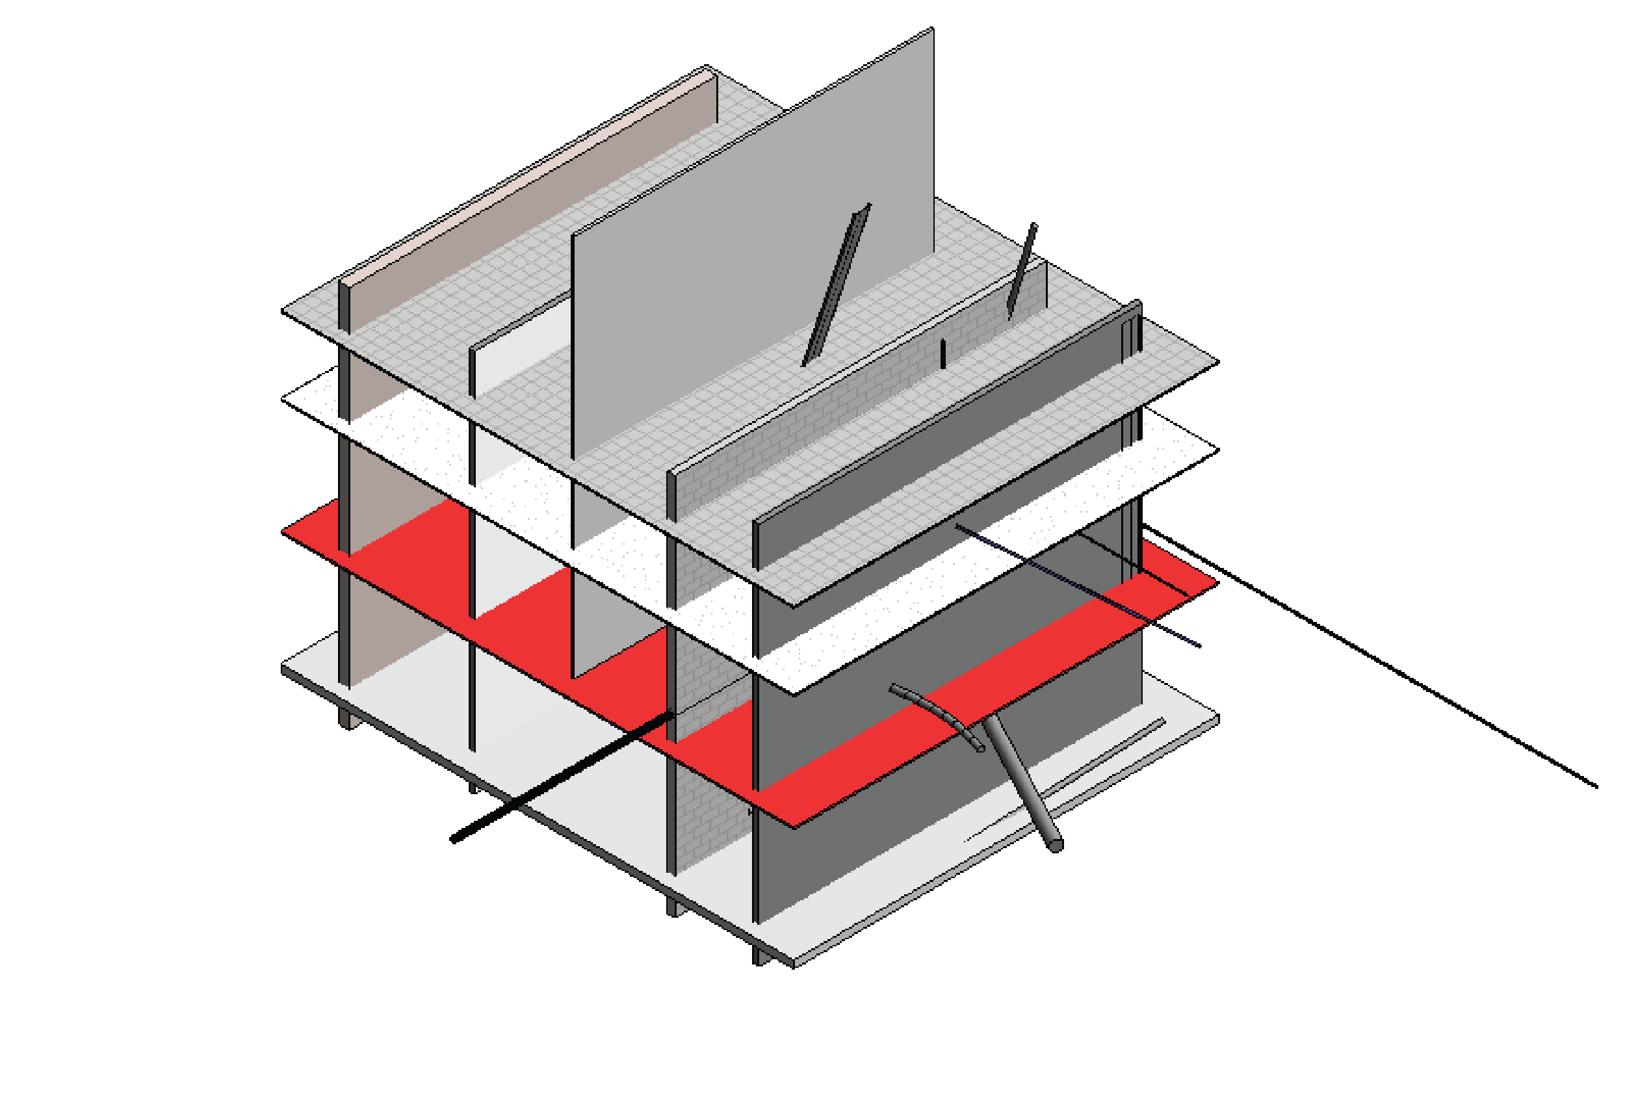
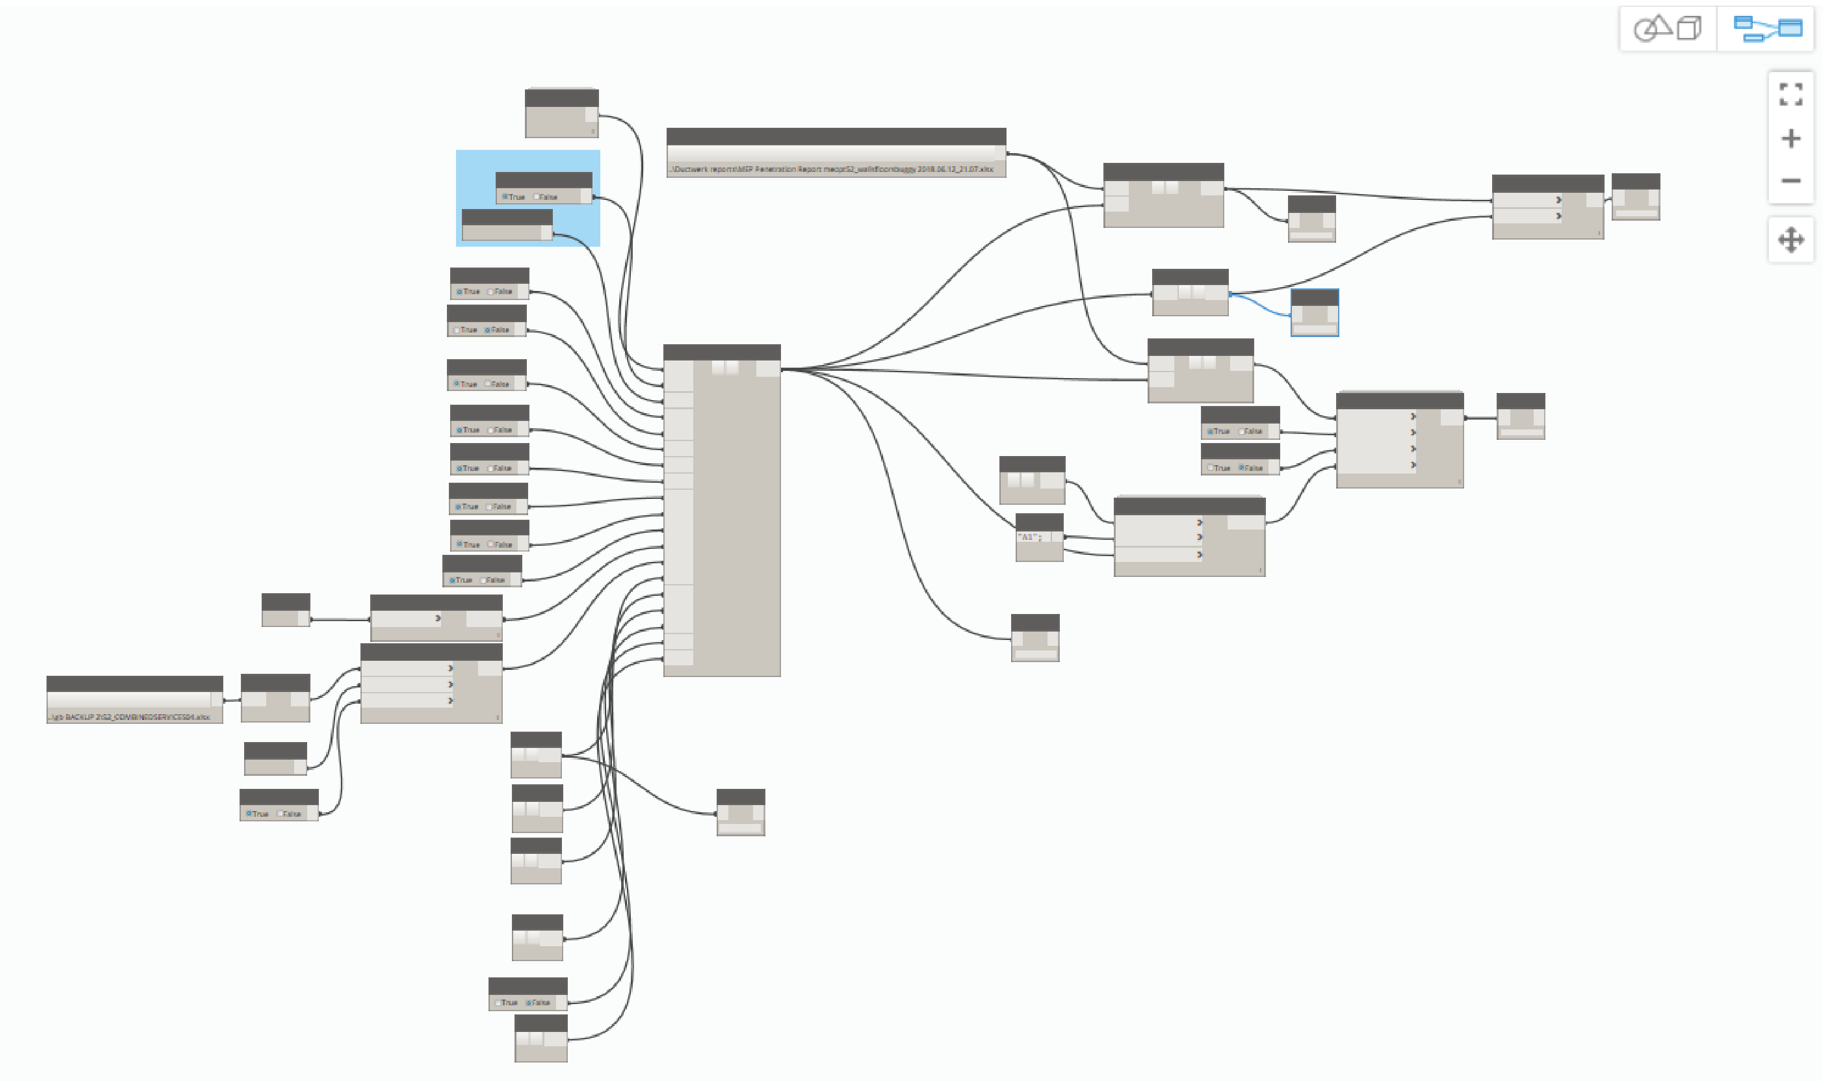
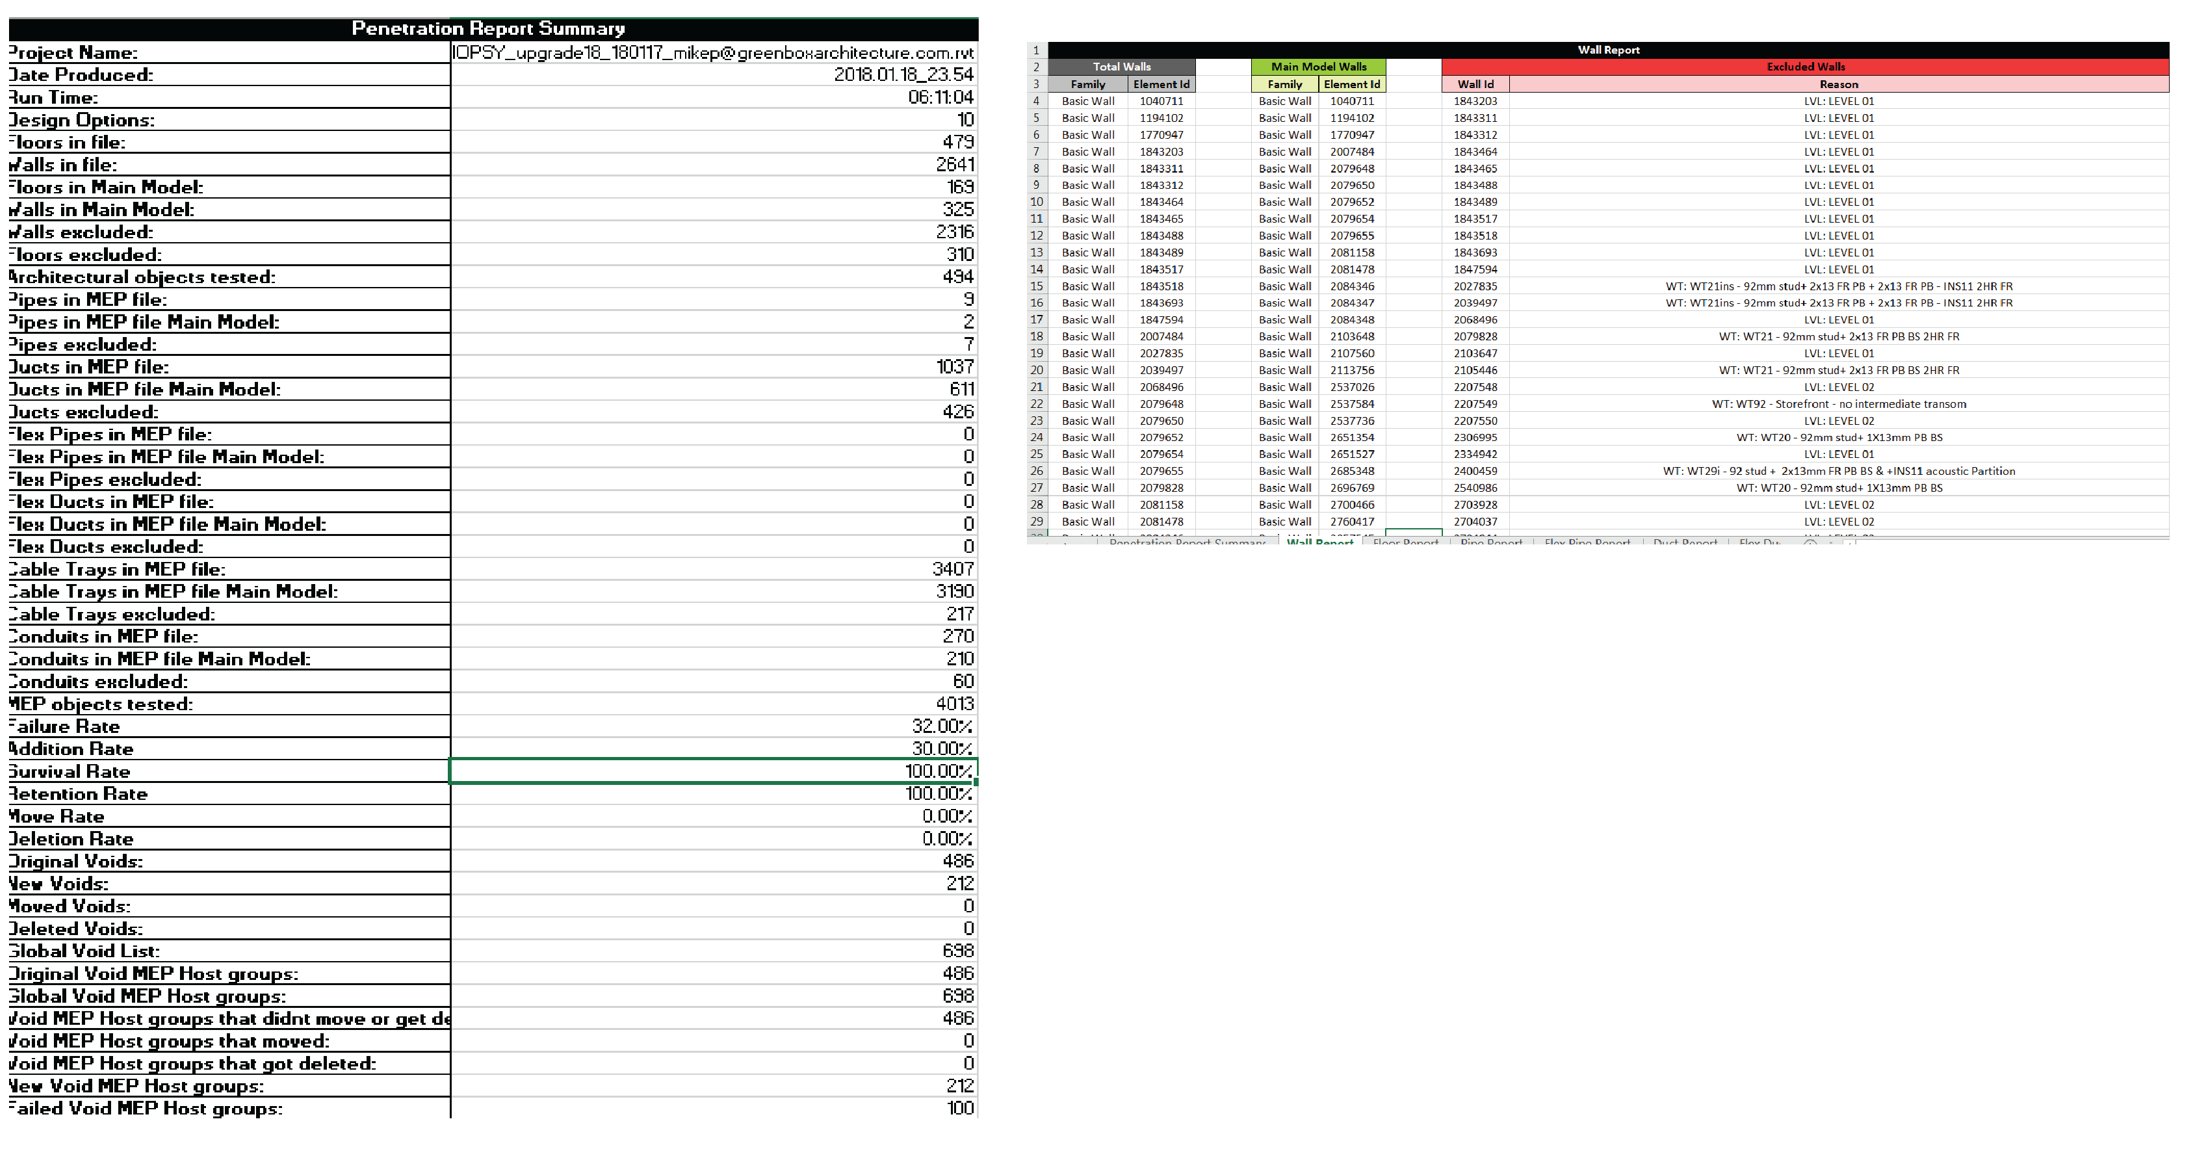
The script uses a spreadsheet to match family types with penetration type (round or rectangular), setting a buffer and hosting a special penetration family per wall or floor element. The script outputs raw data to Excel, where another python script processes it into a well organised Report. As changes are made to any of the consultant models, the script is able to track those changes by comparing a snapshot of a previously timestamped run to the latest file, highlighting modified elements, deletions and additions.